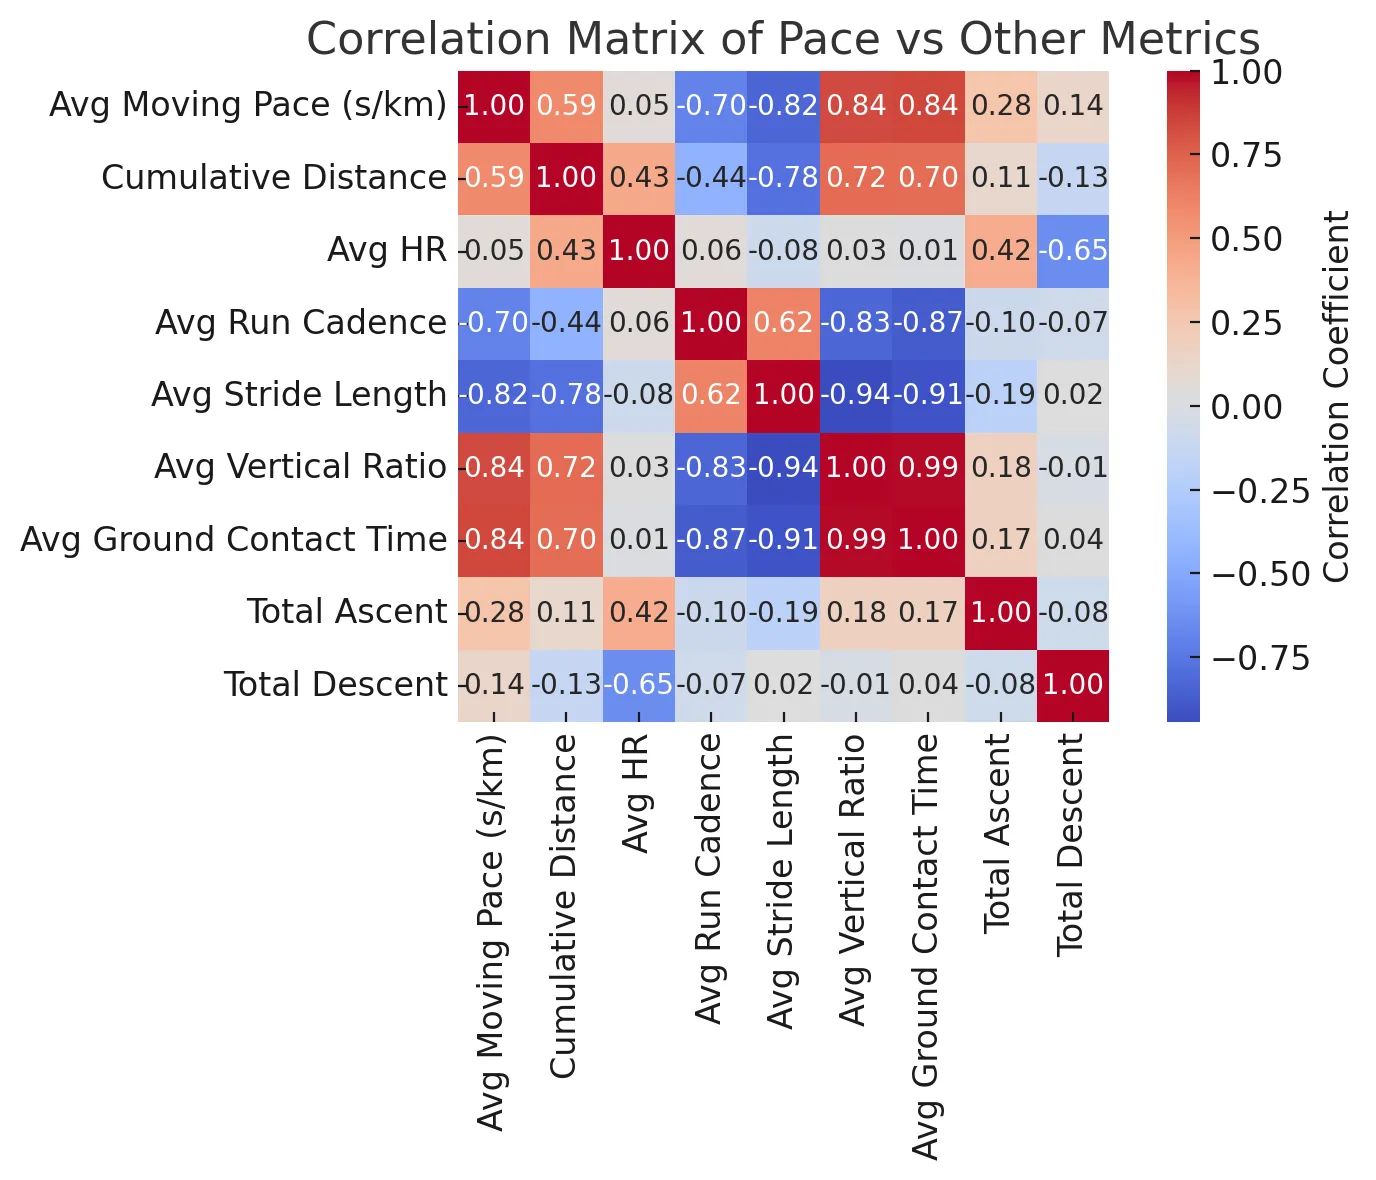
Here’s a correlation heatmap summarizing how various factors correlated with my pace (red tones = positive correlation, blue = negative). Notably, my stride length, vertical ratio, and GCT show some of the strongest correlations with pace, whereas heart rate and descent (downhills) have weaker relationships.
To sum up the analysis, here are the main insights from correlating my Boston Marathon performance metrics with my average moving pace:
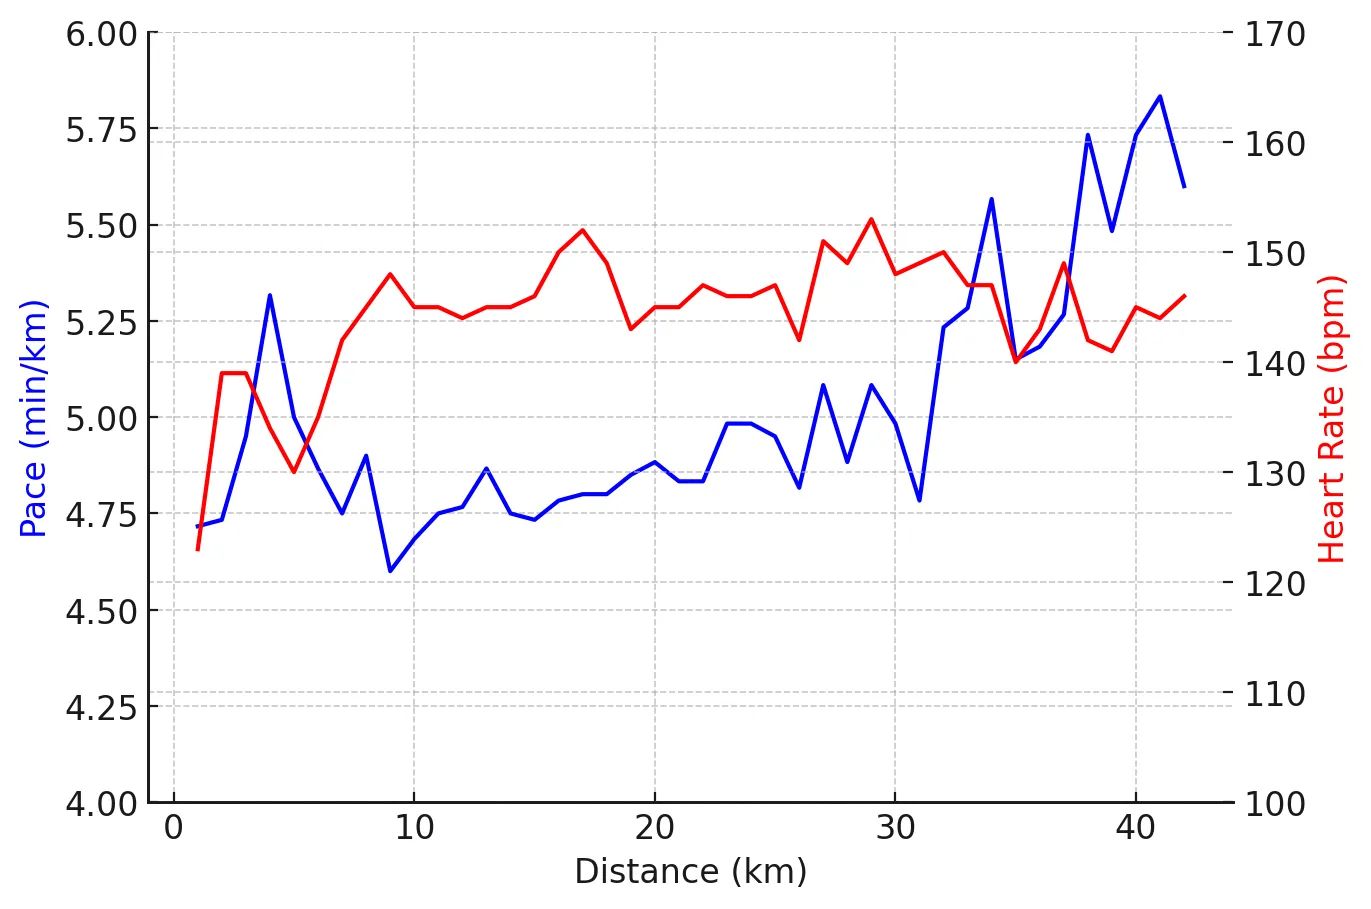
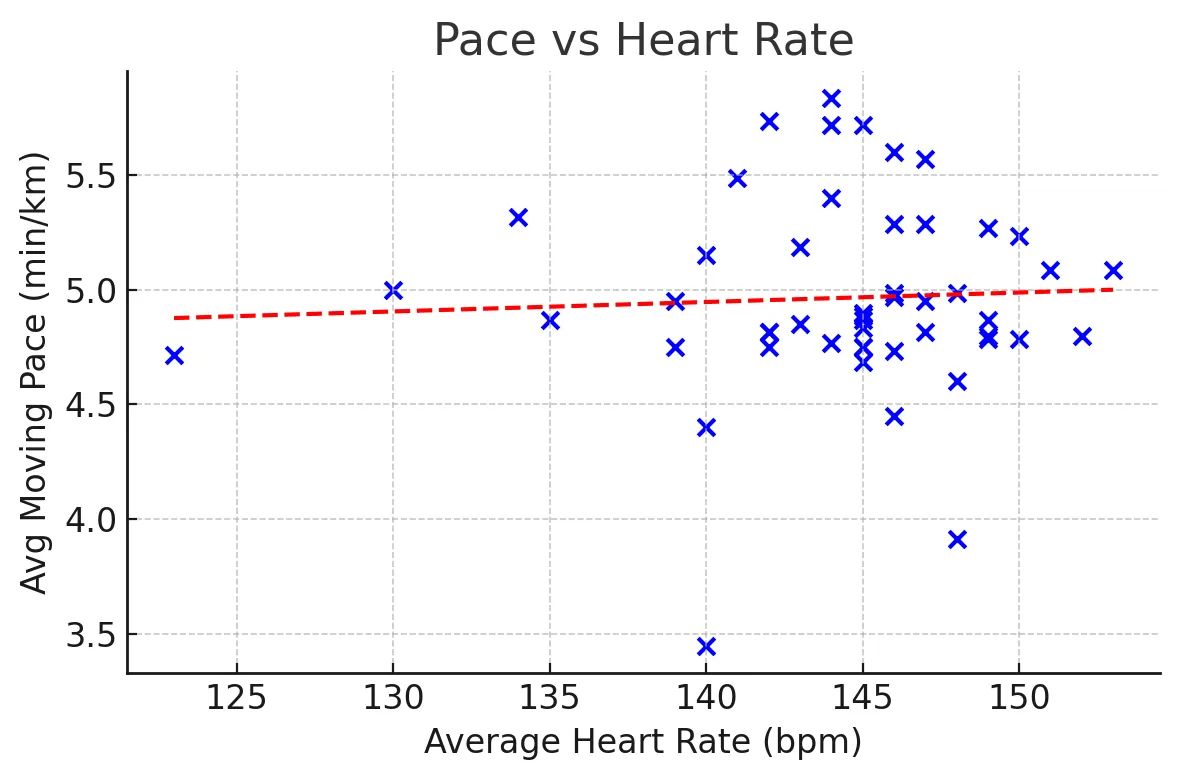
• Heart Rate: Surprisingly weak correlation with pace. Early on, my HR climbed while pace stayed steady, and later on, my pace slowed without any drop in HR. In a marathon, a high heart rate in the final miles doesn’t guarantee speed – it likely just means I’m maxed out physiologically. In Boston, fatigue essentially broke the usual HR–pace link for me.
• Cadence vs Stride: Both mattered, but stride length ultimately had a greater impact on my pace. I kept a fairly stable cadence (only a slight drop when completely exhausted), but my stride shortened significantly as I tired, and that loss of stride length strongly correlated with slowing down. My faster splits came from maintaining a longer stride, whereas a reduced stride length in the later stages was a big contributor to my slower times.
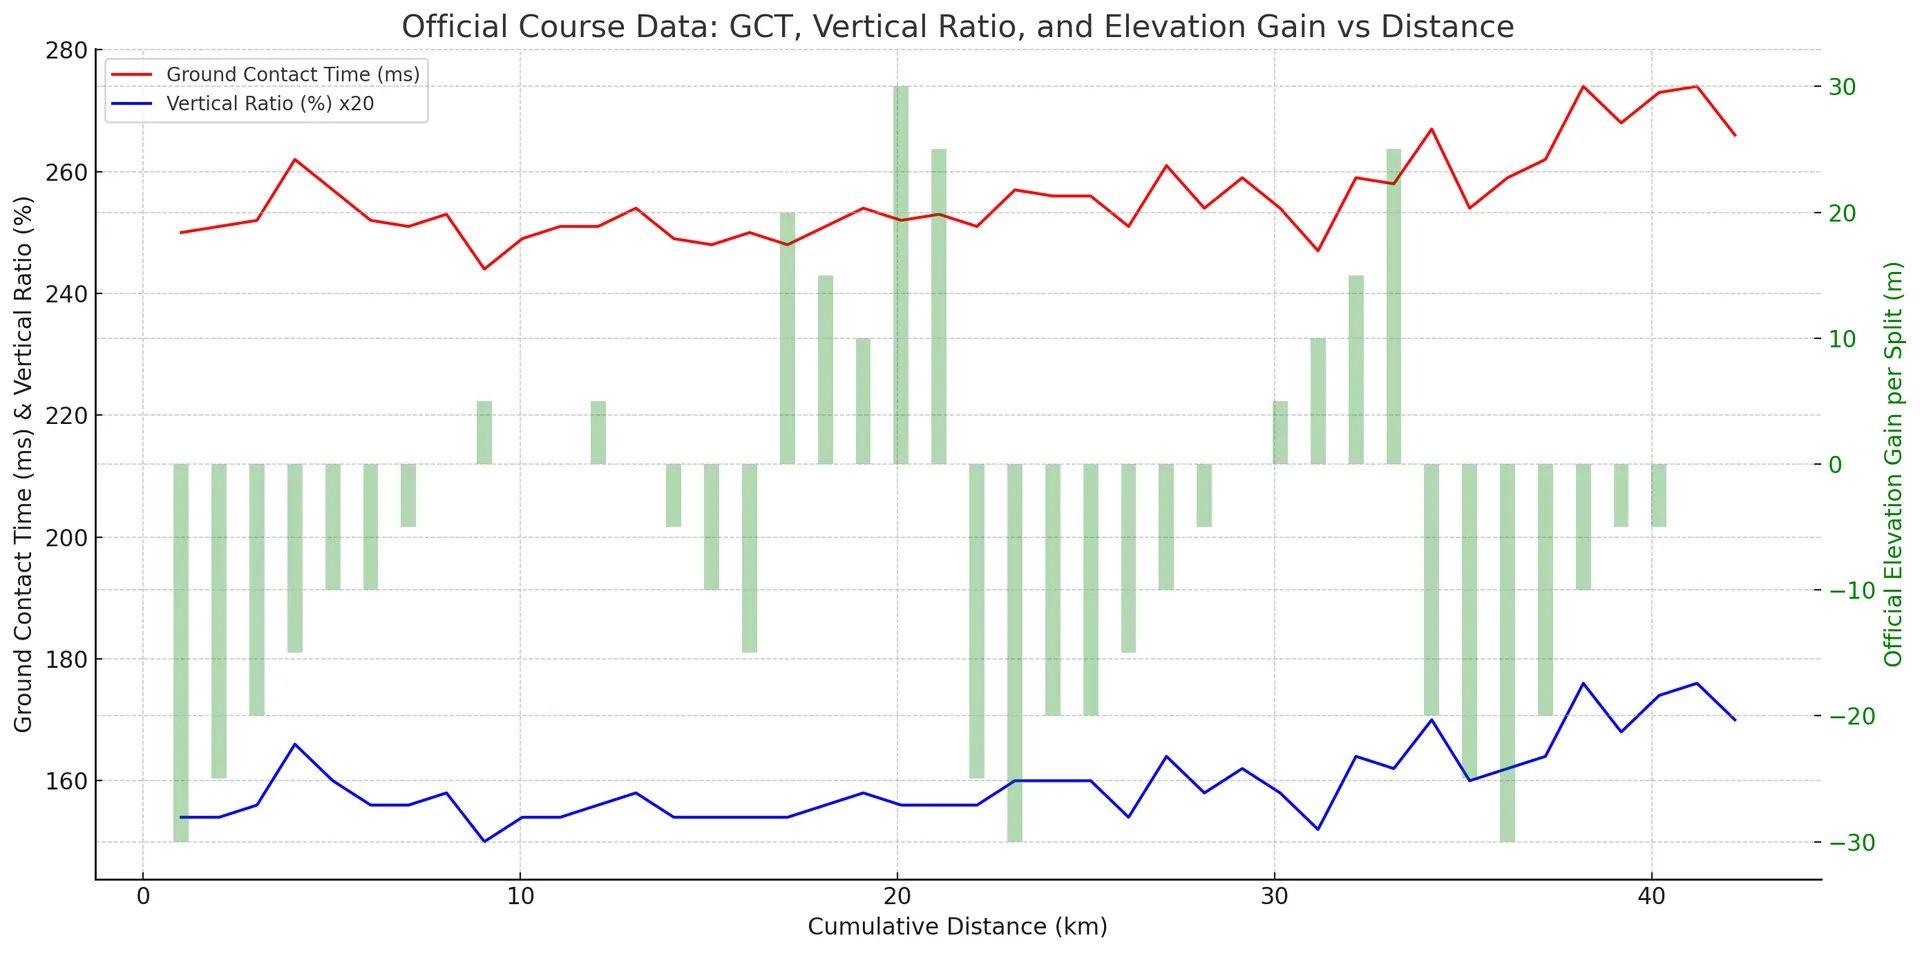
• Vertical Ratio & Ground Contact: These form metrics deteriorated as I slowed. I bounced more and spent more time on each foot strike once fatigue set in. The strong positive correlation with pace means poor running economy (higher vertical ratio, longer GCT) went hand-in-hand with a slower pace in my race. It’s a reminder that holding good form is crucial for maintaining speed when fatigue mounts.
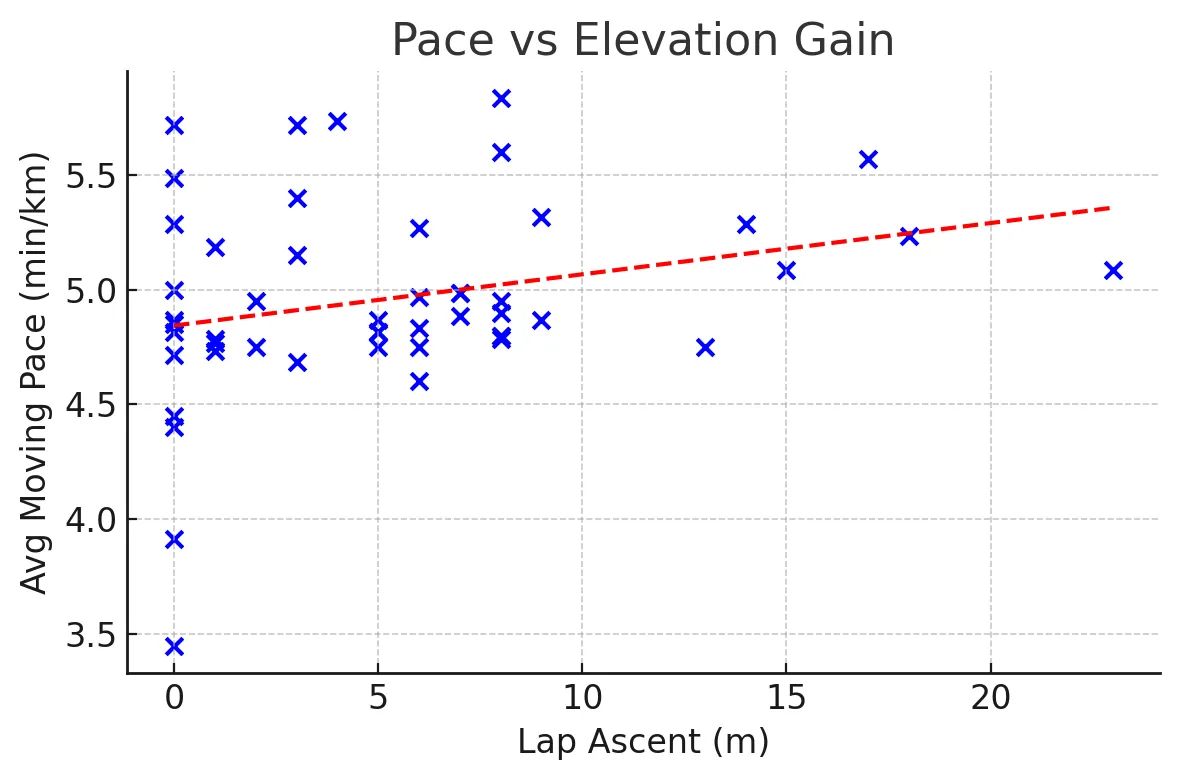
• Elevation (Hills): Hills undeniably affected my pace. Uphill sections resulted in slower splits (shown by a positive correlation between ascent and pace). I lost time on Newton’s hills and Heartbreak Hill – evident from the drop in pace during those laps. Downhills gave me some time back, but by the later miles fatigue had muted their benefit. Net effect: the hills contributed to my overall slowdown by taxing my legs early and leading to compounded fatigue later.
• Power (Effort): Interestingly, my running power (measured in watts) showed little direct correlation with my pace. On uphill segments I often had to output very high power just to keep moving (yet I still slowed due to the incline), and in the later kilometers I was pushing hard simply to maintain a slower pace. In other words, raw power output didn’t always translate to speed on this course. Factors like efficiency and endurance played a bigger role – high effort could only do so much when my legs were fatigued.
• Distance/Fatigue: There was a clear trend of slowing down as the race went on. The correlation stats (Distance vs Pace) and my split times confirm that the final 10K was significantly slower than the early miles. This was due to accumulated fatigue compounded by all the earlier factors (hills and form breakdown). Essentially, I hit “the wall” in the last quarter of the race, which showed up in every metric – from heart rate decoupling, to shorter strides, to overall slower speeds.
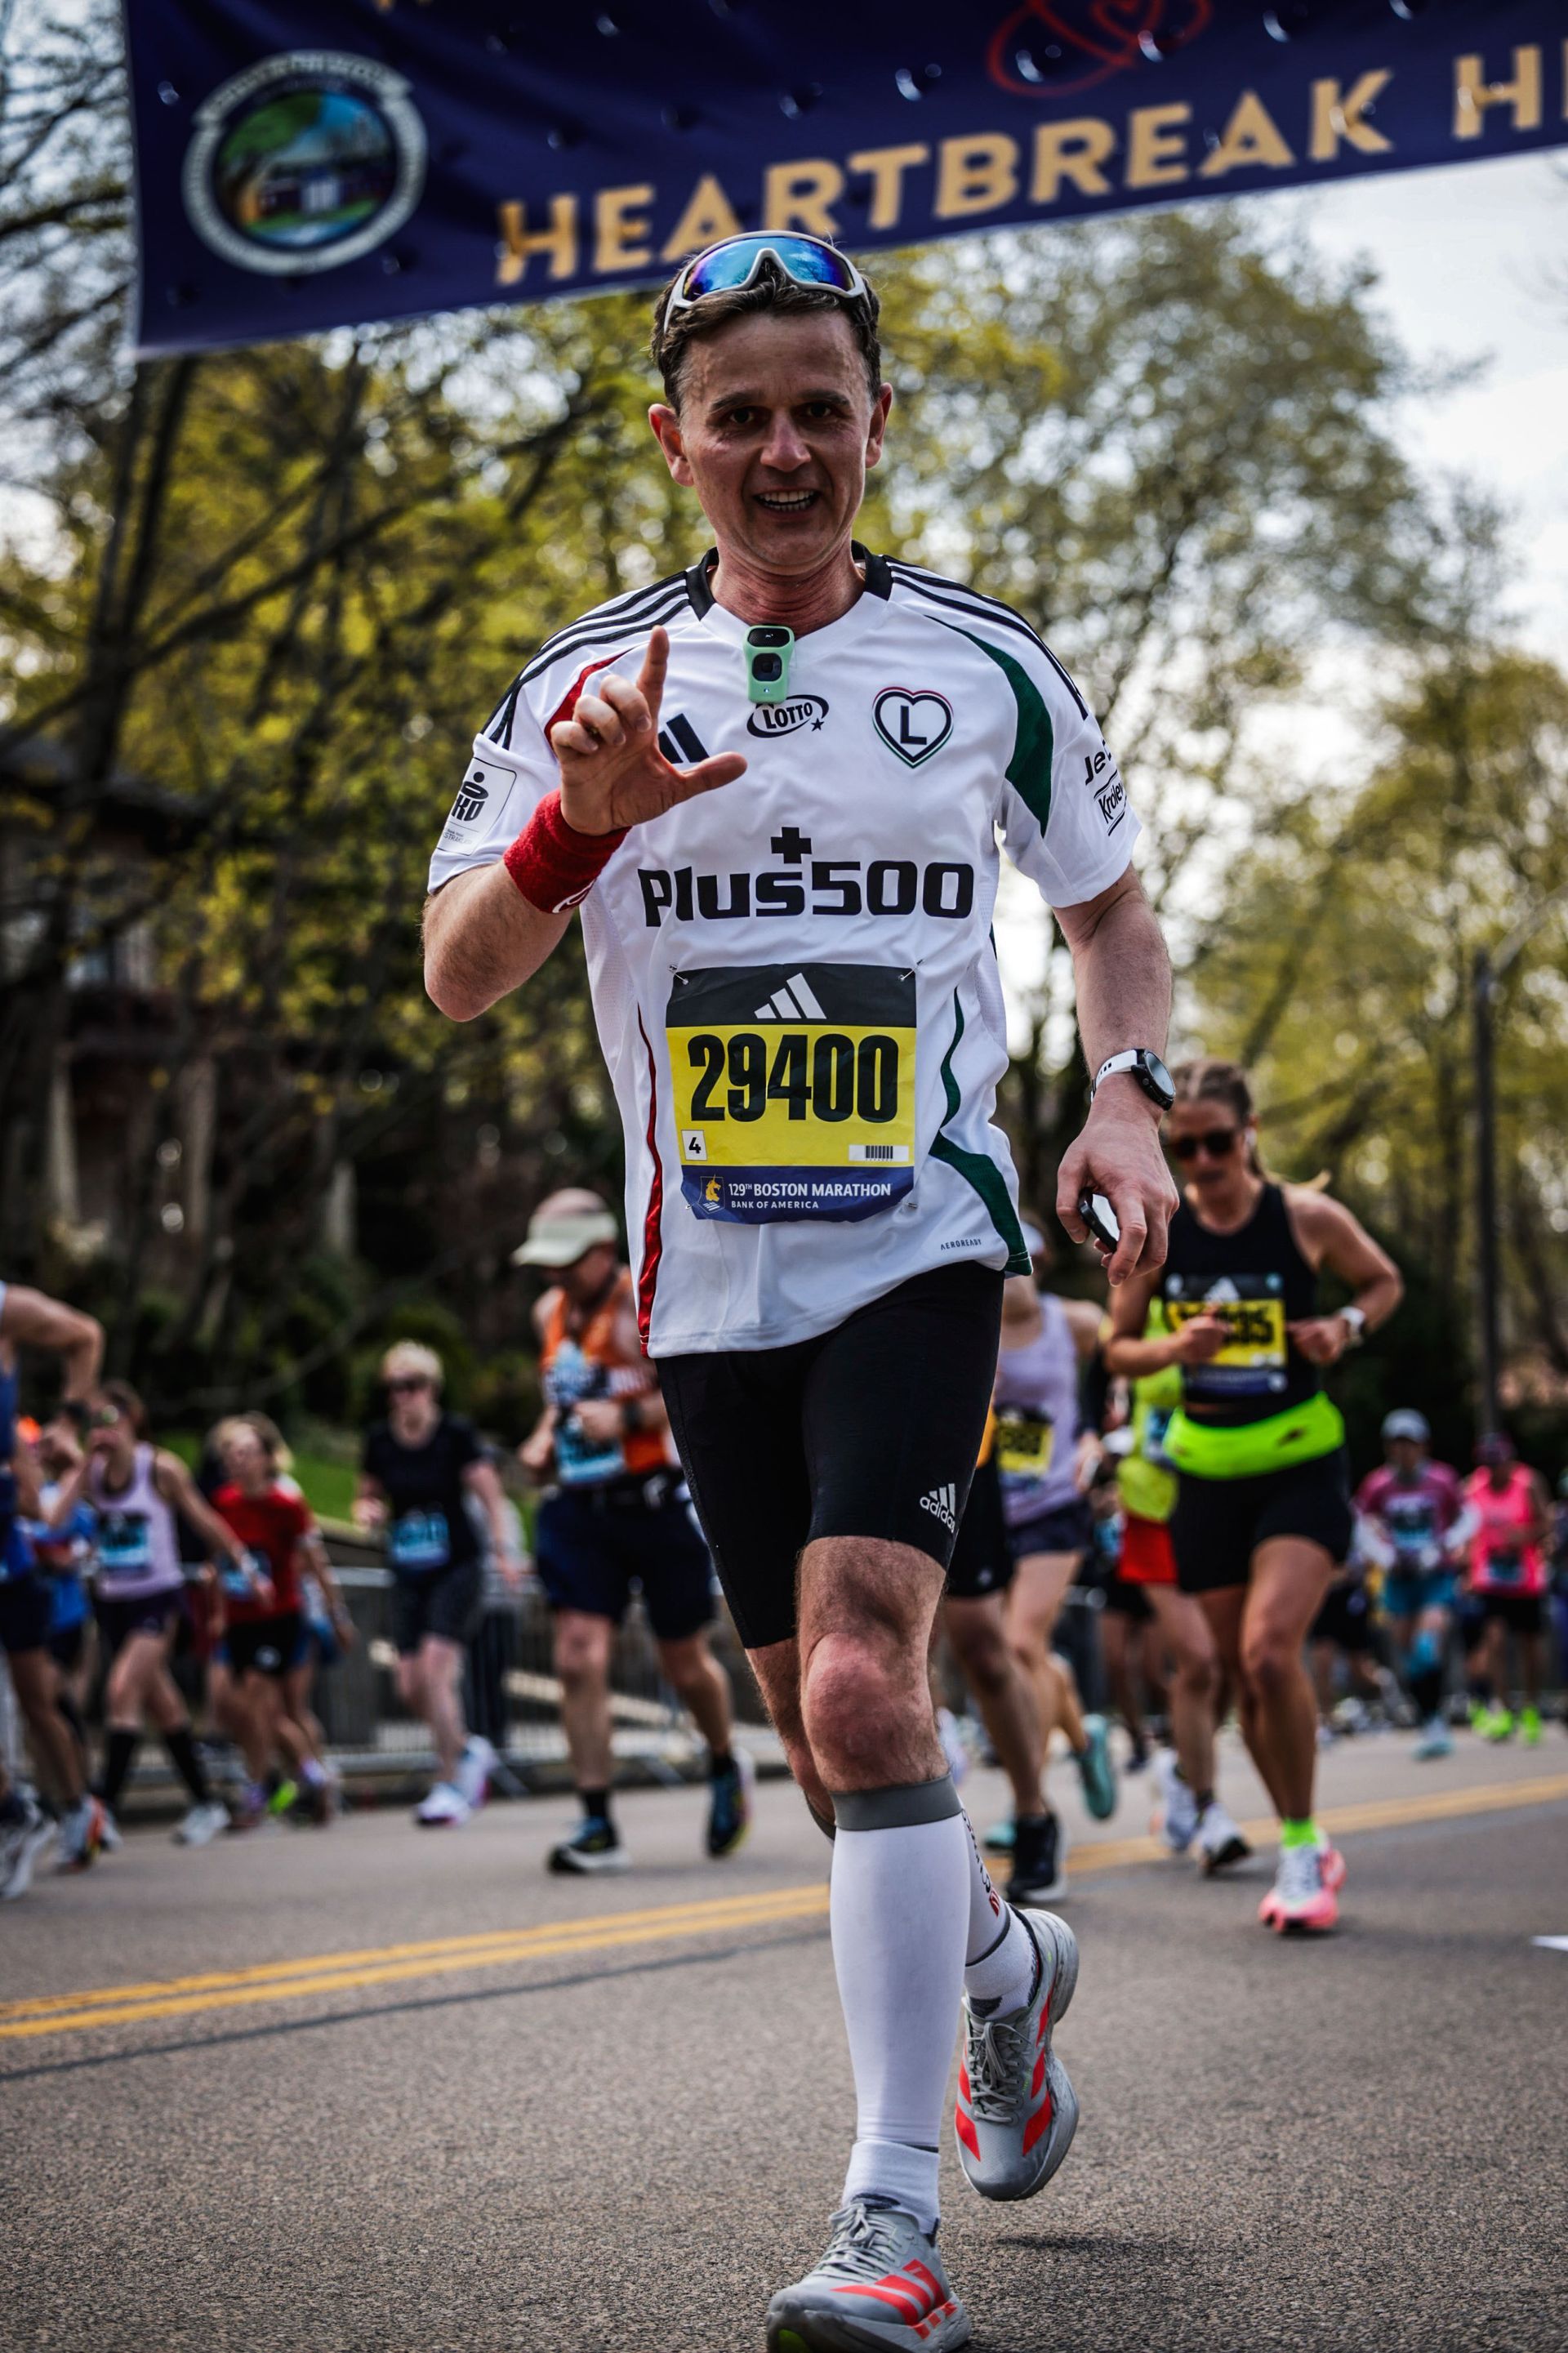
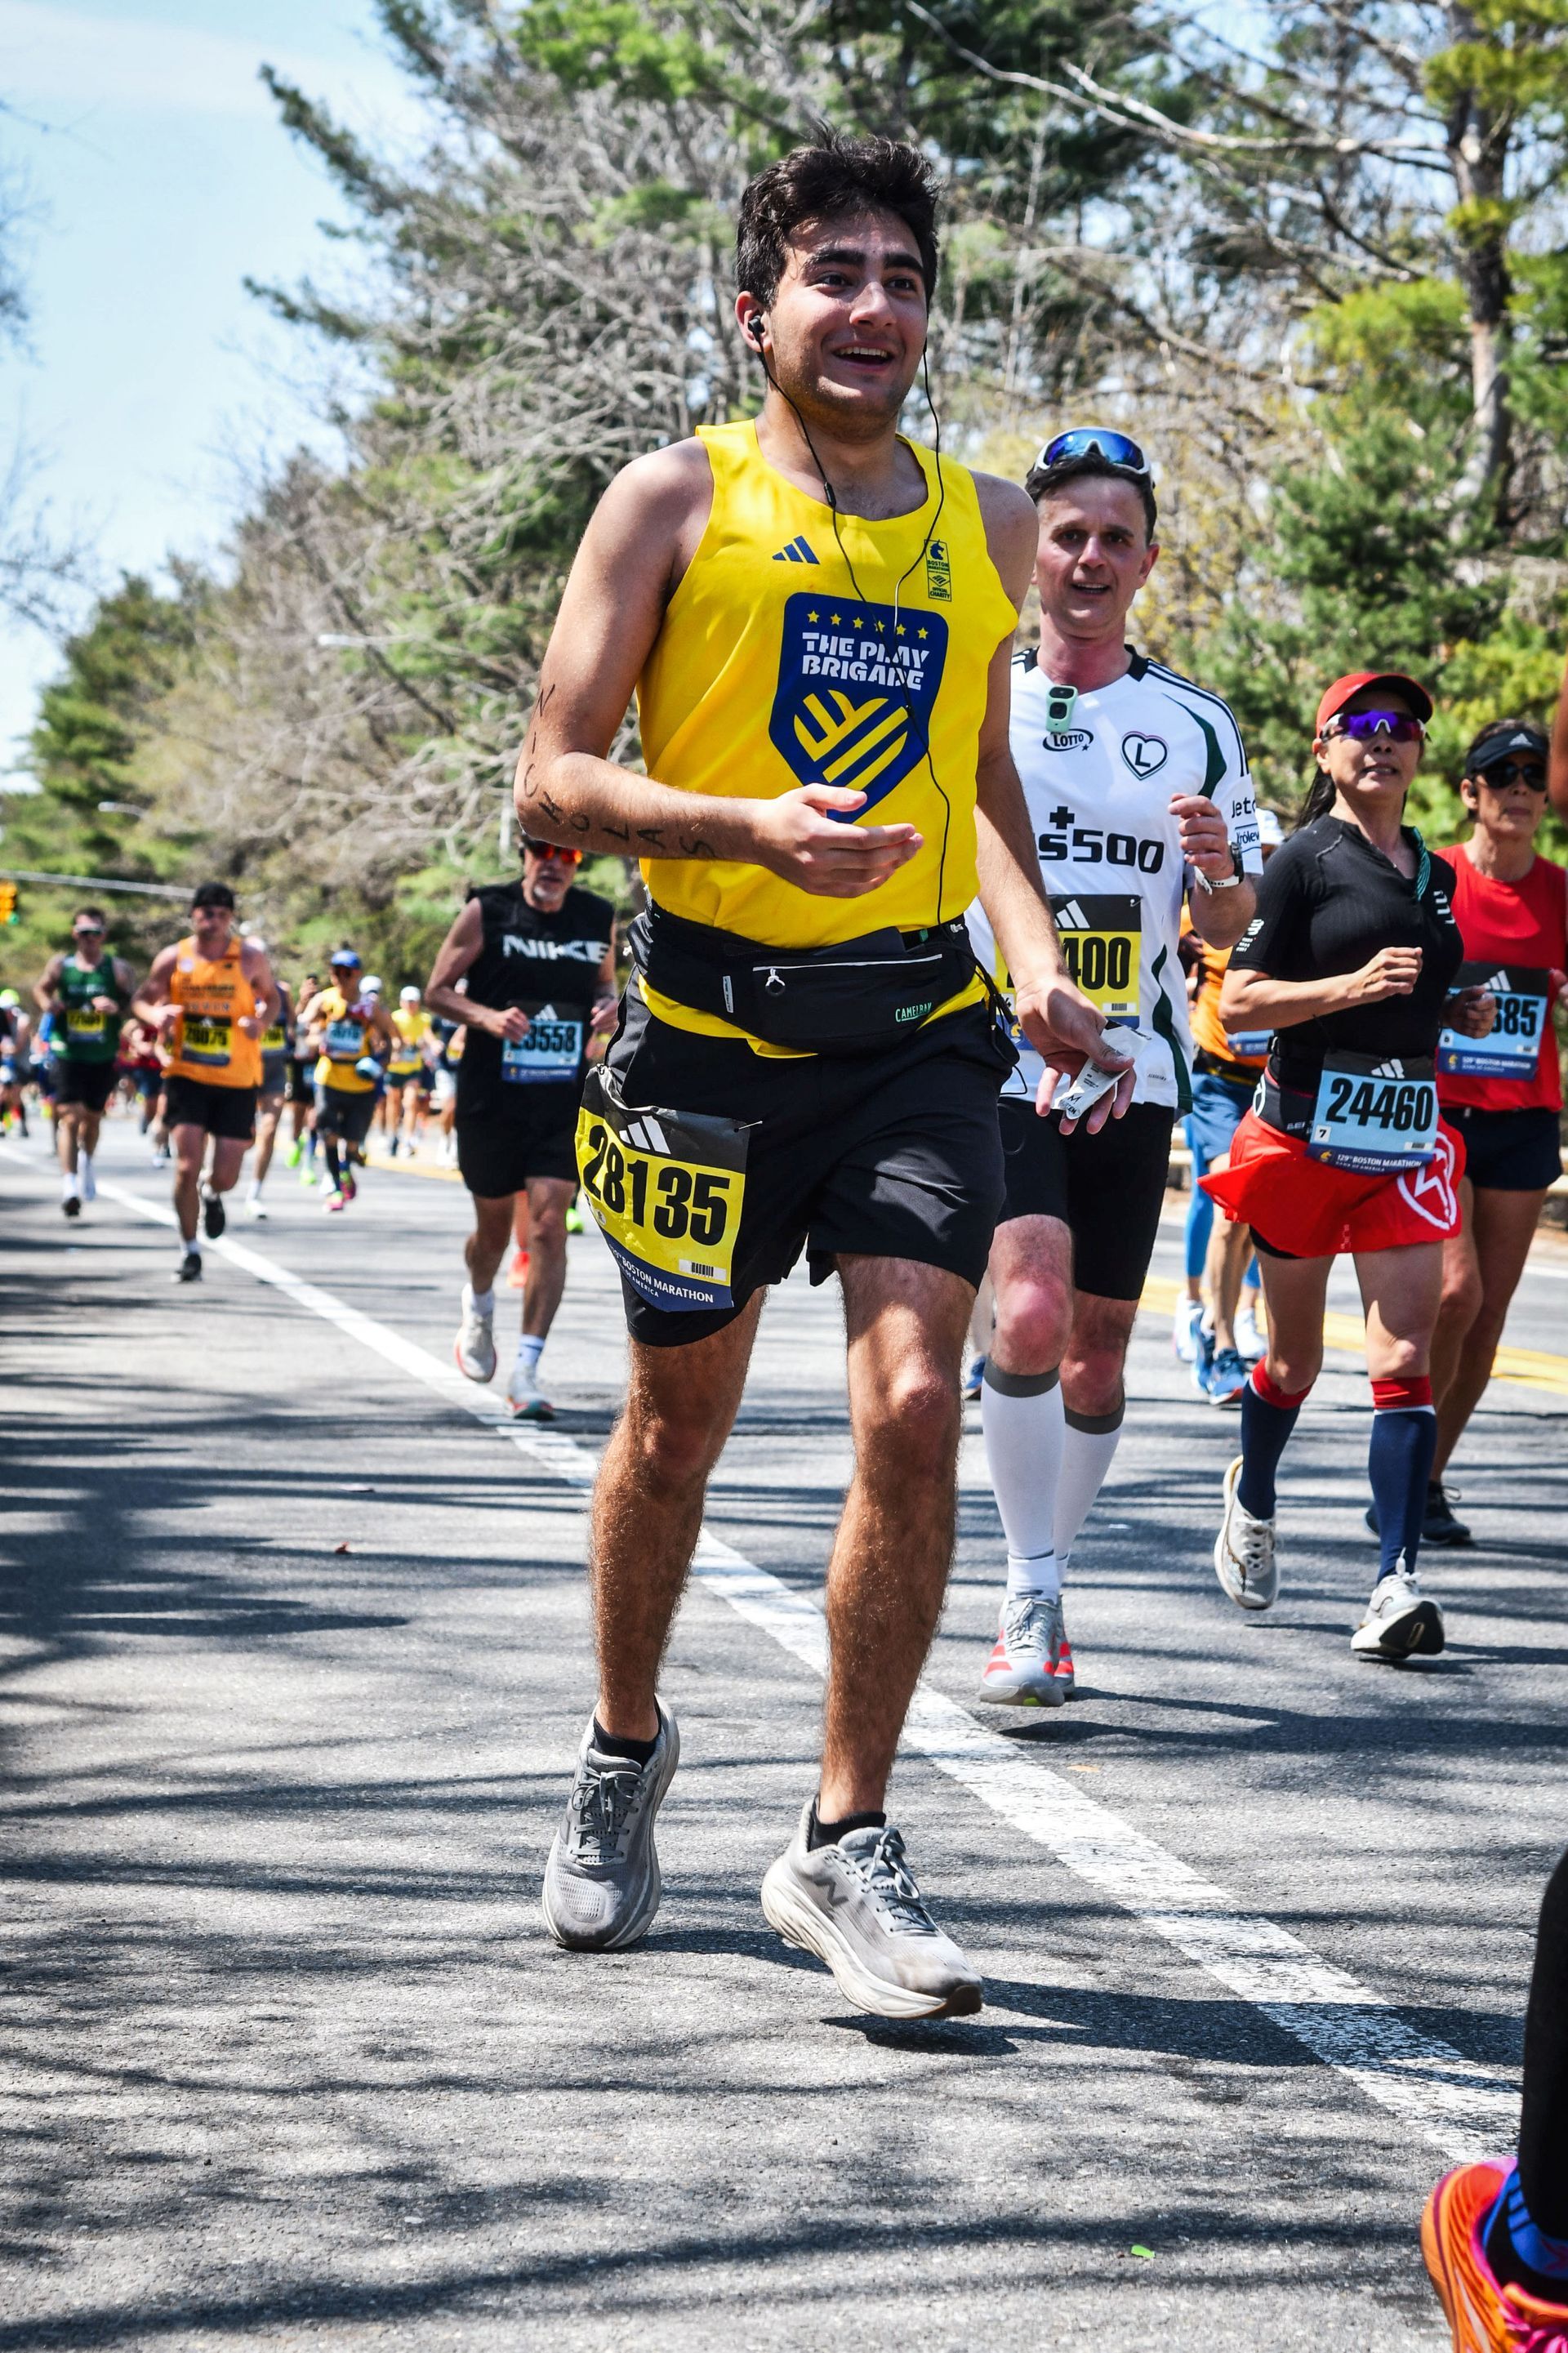
In a narrative sense, my Boston Marathon unfolded as many do: I started strong and efficient, weathered the mid-race hills at a cost, and then fought through mounting fatigue to the finish. The data enriches this story by quantifying those effects – showing exactly how much my pace dropped, how my body responded (heart rate), and how my form changed when the going got tough. For fellow runners, the takeaway is that maintaining form and pace in a marathon is a complex balancing act of energy management, strength, and technique. When one element falters (like stride length, in my case), the whole system (pace) slows down.
Overall, analyzing all this Garmin data after the race gave me a deeper appreciation for what my body went through over 42.2 km. It paints a clear picture of how heart rate, cadence, stride, hills, and fatigue all intertwined to shape my Boston Marathon performance. And of course, it provides targets for improvement – perhaps more hill training, form drills, and better pacing or fueling – so I can aim for a stronger finish and more even splits in my next marathon. Running a marathon is as much a data story as it is a personal journey, and this data-driven look will definitely inform my training going forward


.jpg&w=3840&q=75)